A Net Zero University
A new baseline emission figure for 2018/19 of 105,430 tonnes of carbon dioxide covering scope 1, 2 and 3 emissions was established. A model of comprehensive actions to drive the required carbon reductions to achieve net zero by 2040 across scope 1, 2 and 3 provided us with our Net Zero Plan.
To align with NI ambitions, we also have an interim target of 45% reduction by 2030 across scope 1 and 2. To achieve these targets, the University has set aside over £6 million in support of our journey to net zero.

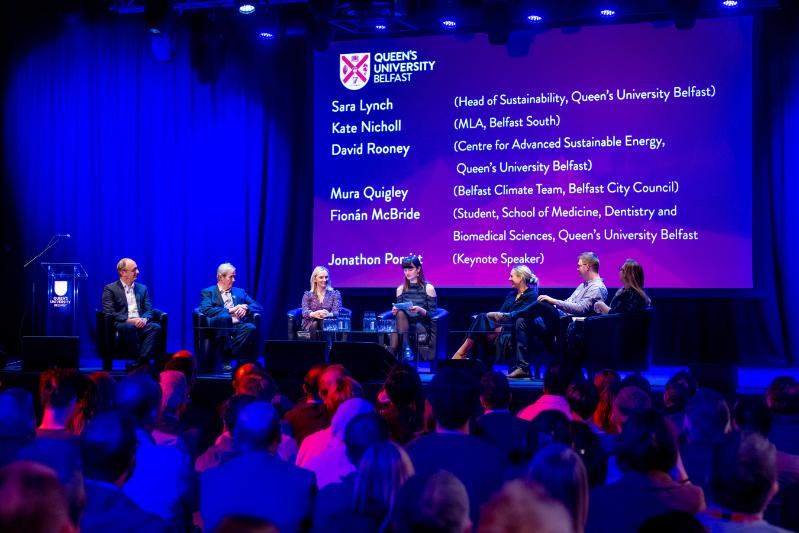
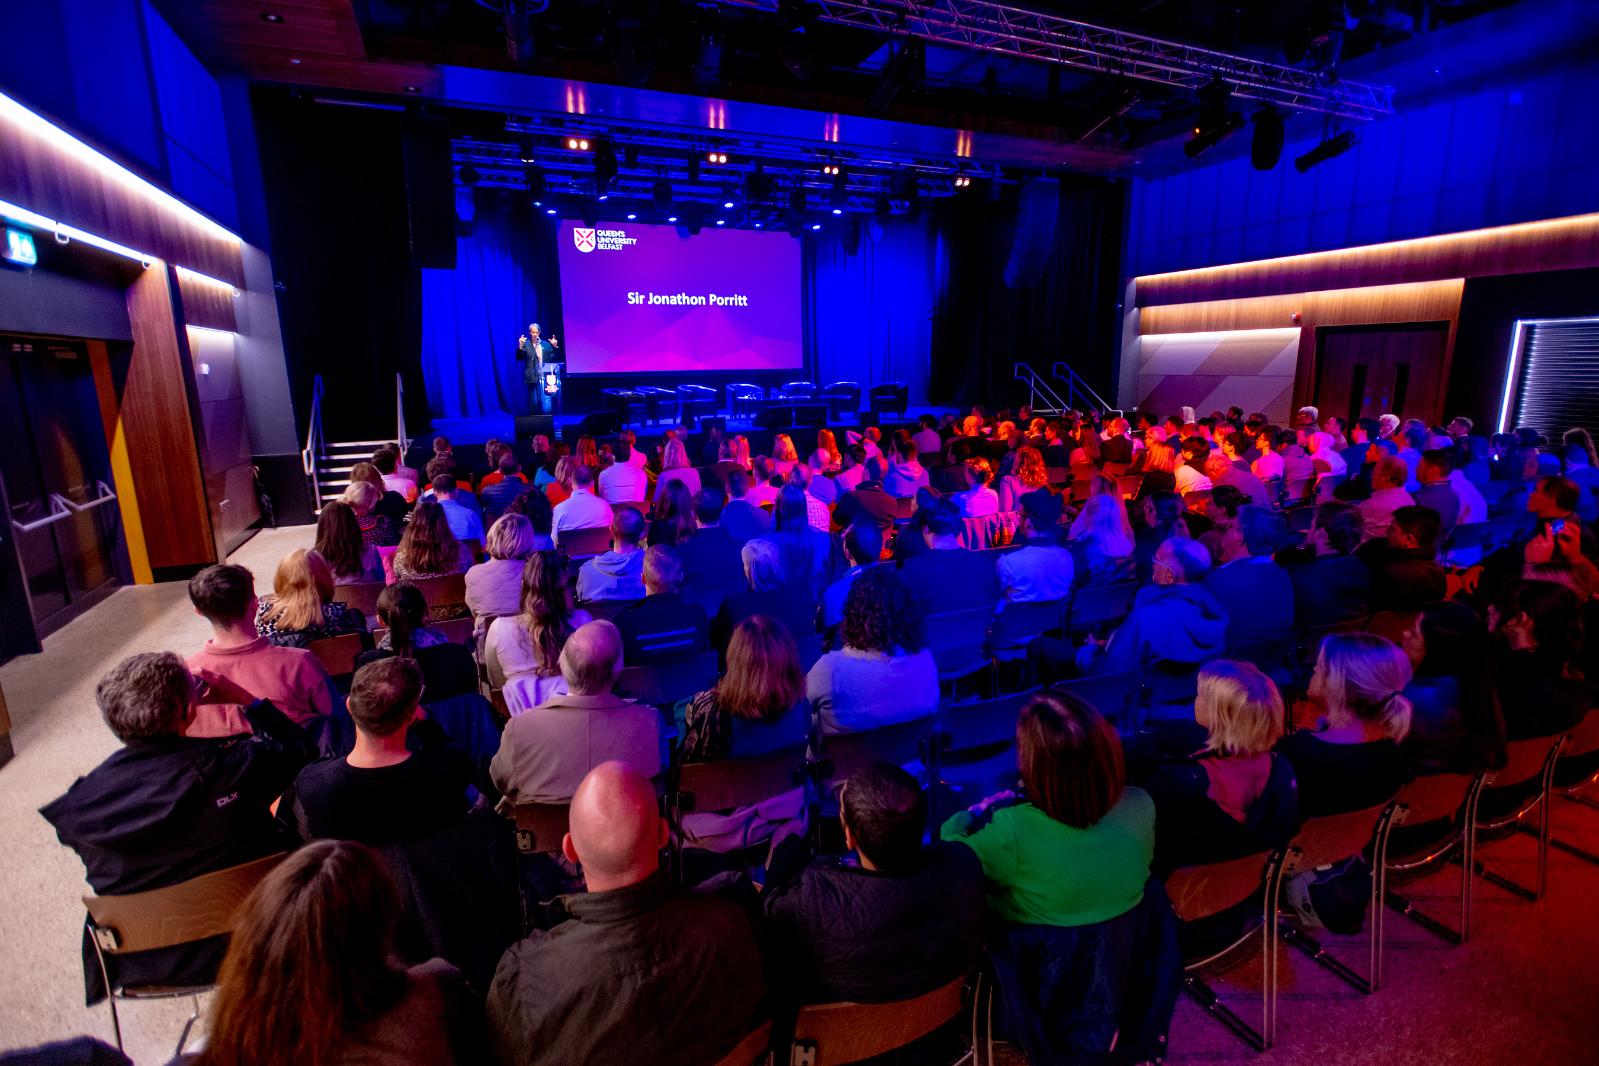
In celebration of the launch of Queen's Net Zero Plan, a number of activities took place on Thursday 19 October to recognise this momentous, and important, aspiration.
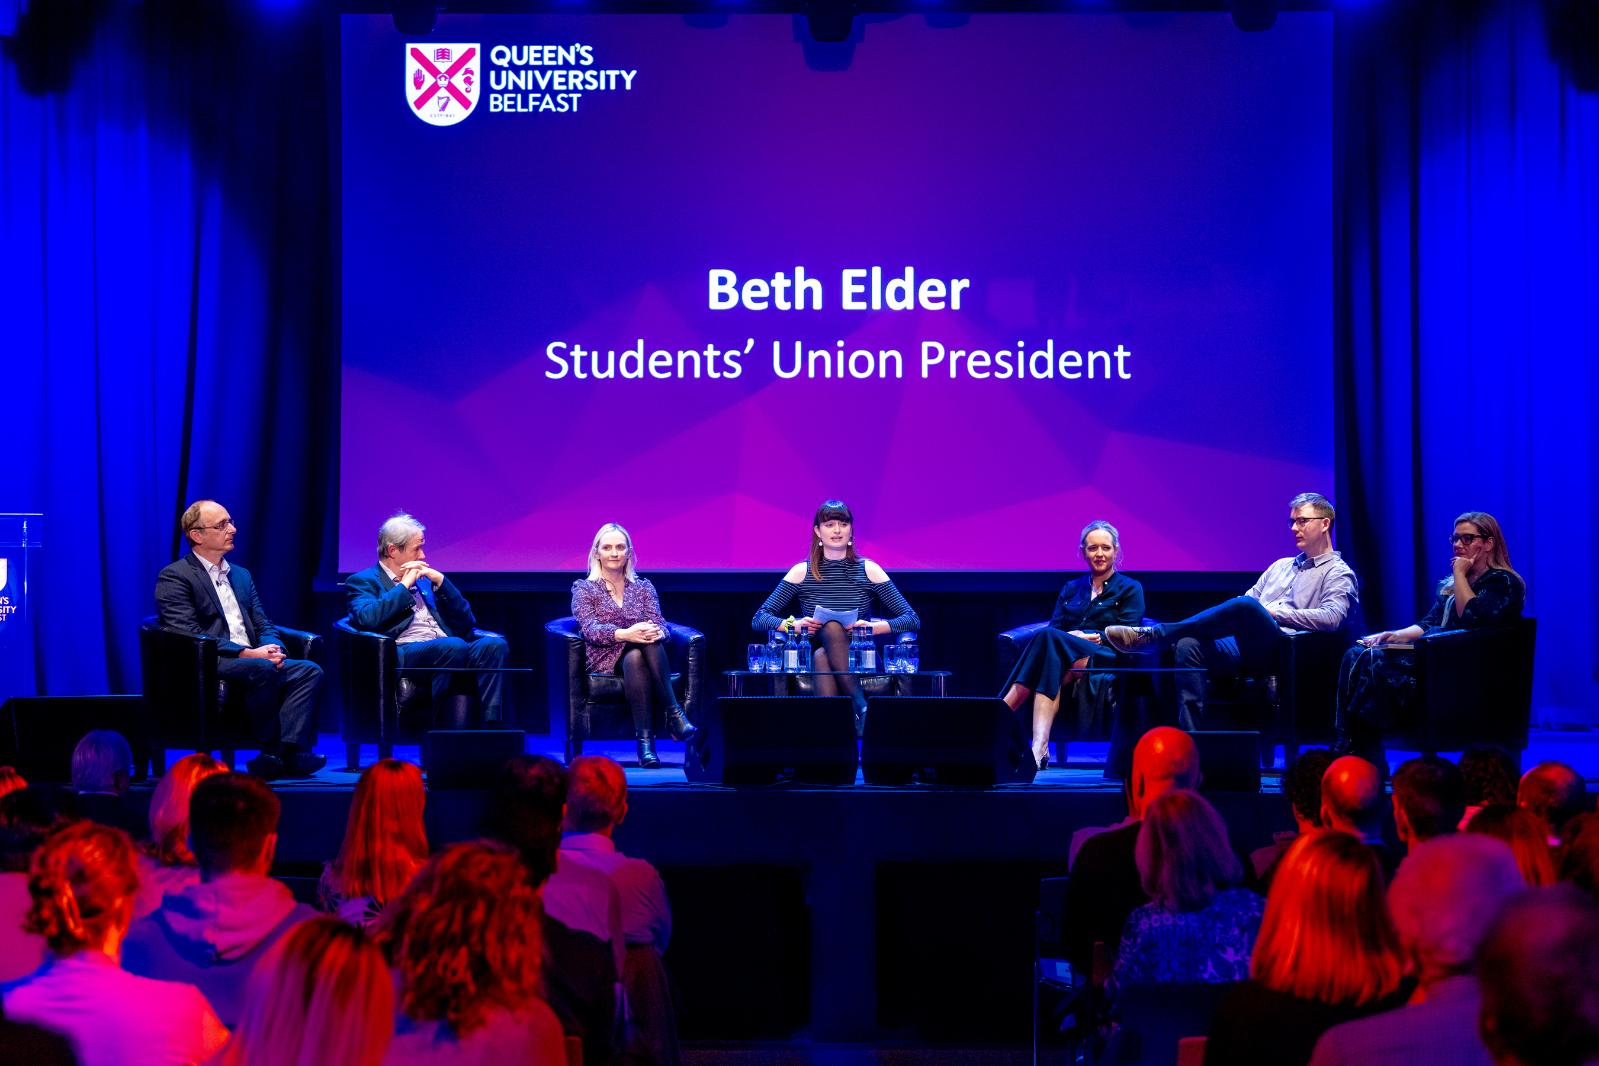
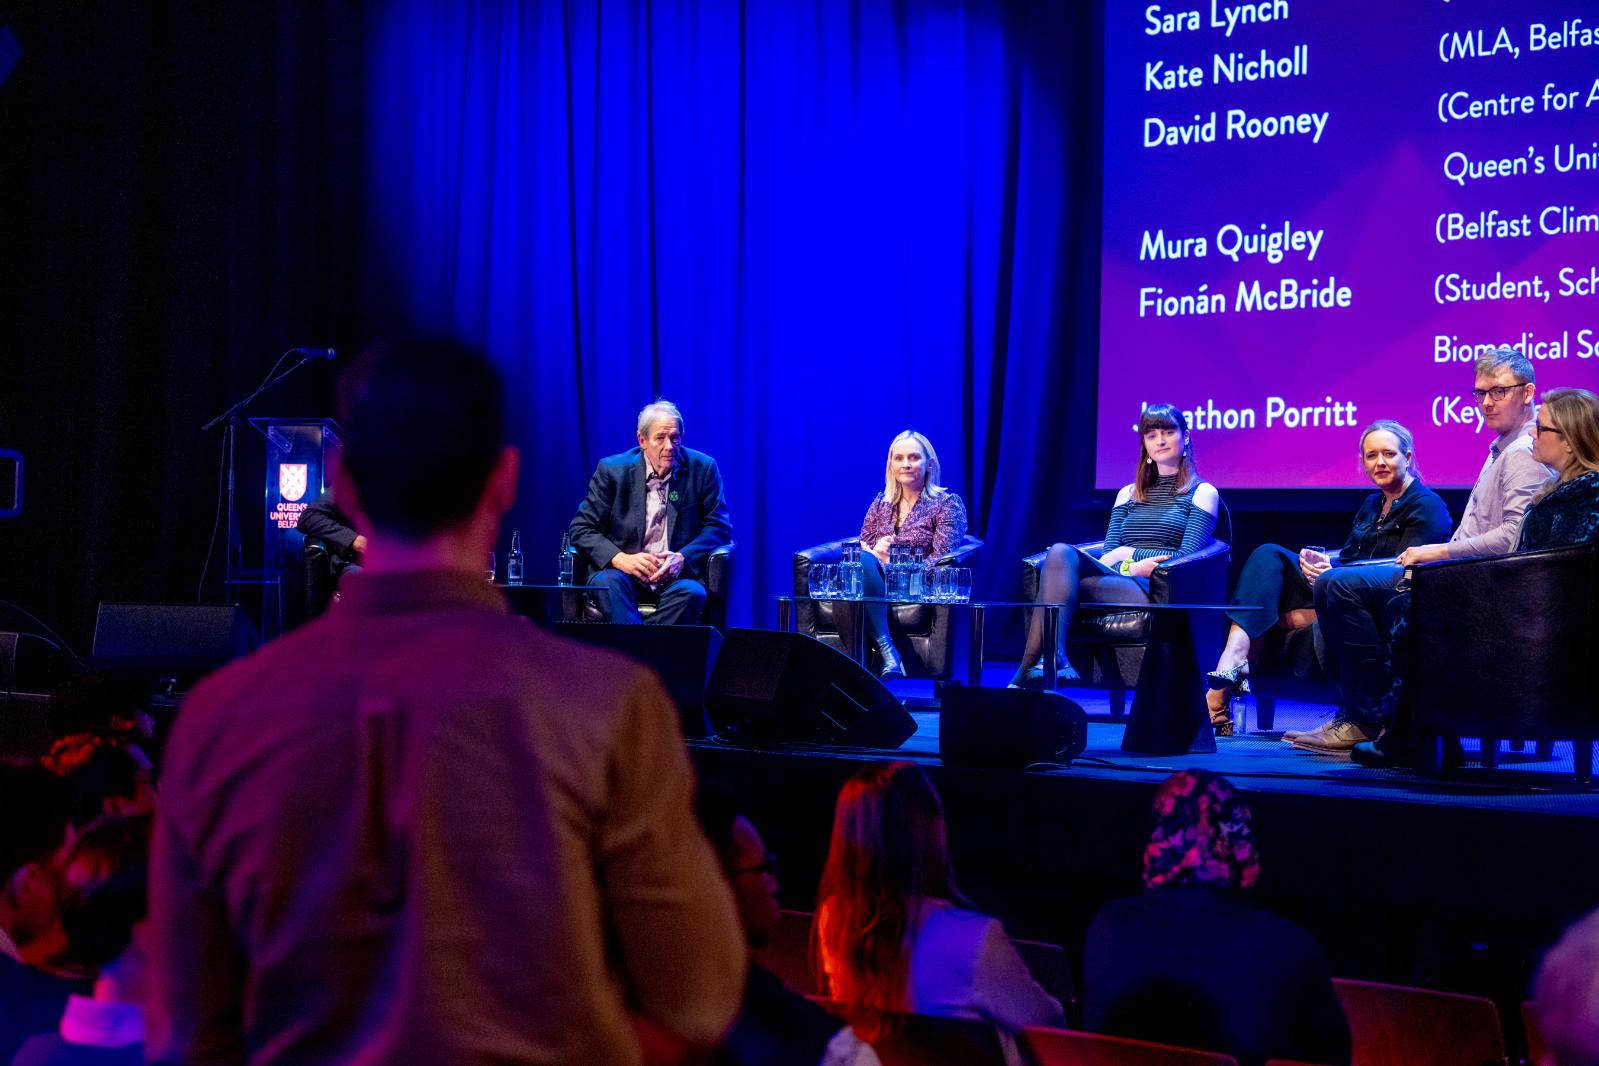
The Net Zero Launch involved renowned international environmentalist, Sir Jonathon Porritt and a student-led discussion panel with local climate experts. The day concluded within Queen's inaugural Annual Sustainability Lecture by Sir Jonathon Porritt.
Read more Read less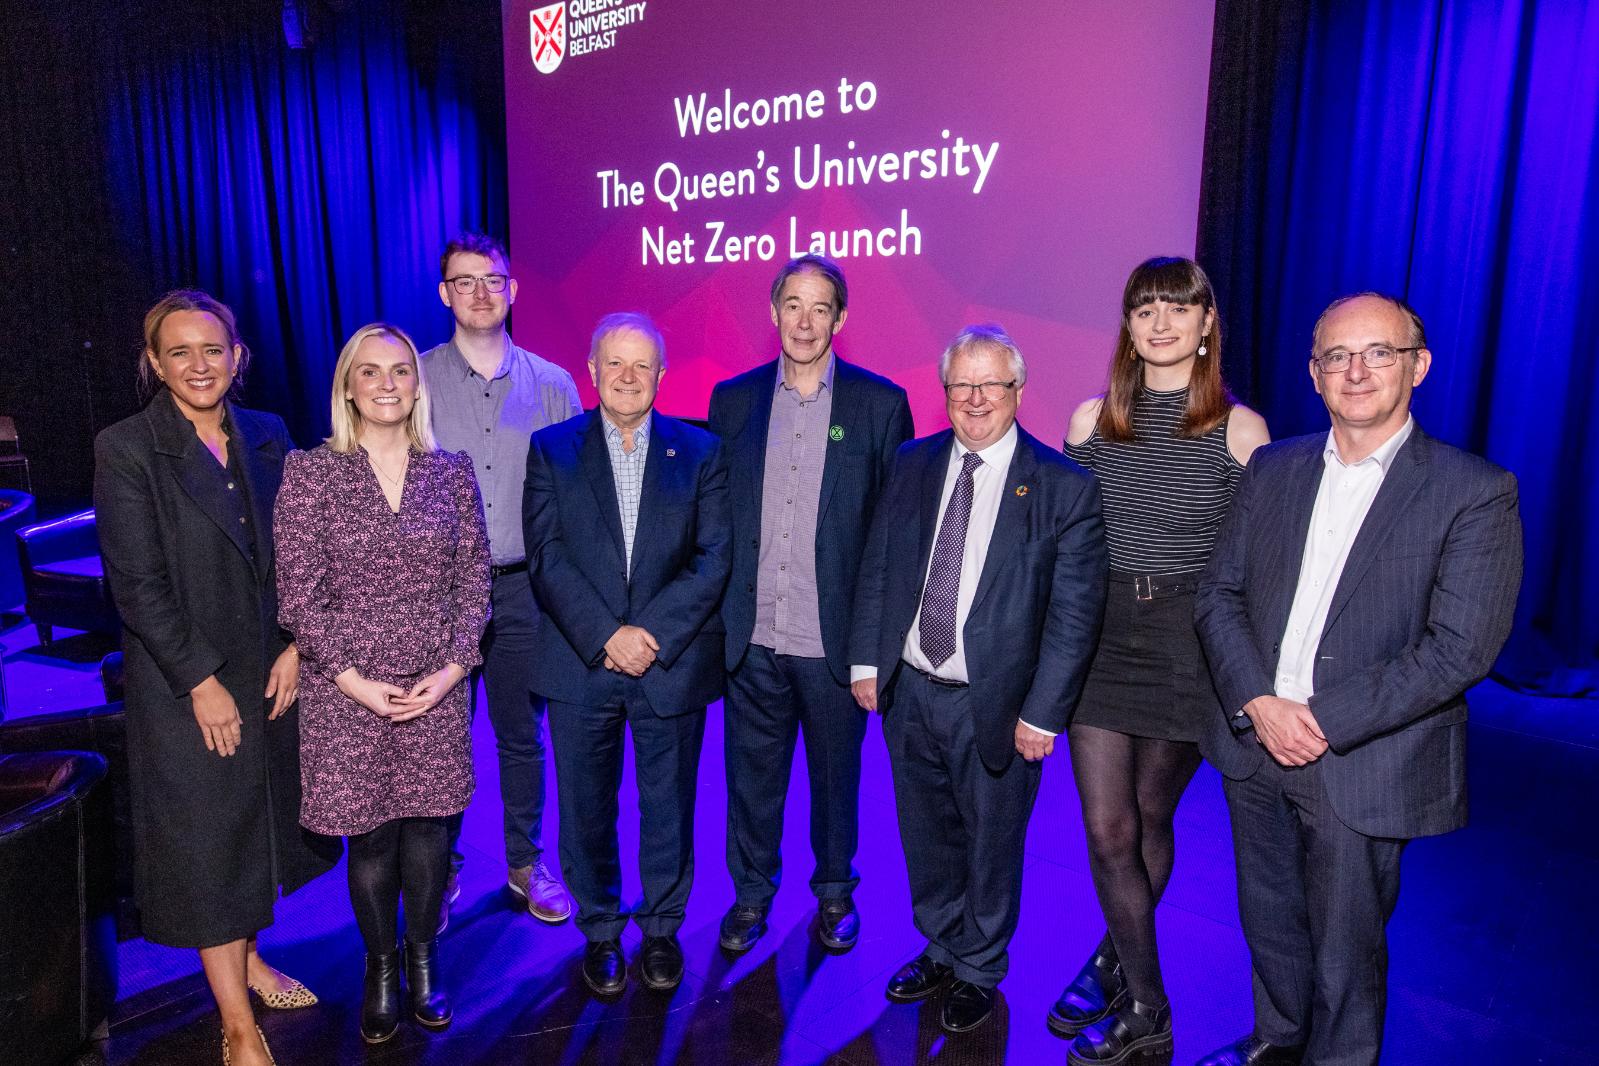
A breakdown of Queen's University scope 1, 2 and 3 based carbon emissions for the academic years 2023-2024, 2024-2025 and 2018-2019 (baseline year) .
This data has been reported in line with the Greenhouse Gas (GHG) Protocol Corporate Standard and the Environmental Association Standardised Carbon Emissions Framework (SCEF).
| Interim Targets | 2024-2025 | 2023-2024 | 2018-2019 |
|---|---|---|---|
| 50% reduction in scope 1 and 2 carbon emissions by 2030 (market based) | 41% | 29% | 0% |
| 100% fleet EV by 2030 | 52% | 23% | 3% |
| 50% reduction in business travel by 2030 against 2018/19 baseline | 38% reduction | 42% reduction | 0% |
| 25% reduction in staff and student commuter travel by 2028 | 10% reduction | 12% reduction | 0% |
| 90% residential and non-residential waste diverted from landfill | 100% | 96% | 92% |
| 50% residential and non-residential waste recycled | 40% | 49% | 60% |
| 100% of Schools, Centres and Directorates engaged in sustainability programmes by 2030 | 83% | 50% | 50% |
| Scope 1 & 2 Emissions | 2024-2025 | 2023-2024 | 2018-2019 |
|---|---|---|---|
| Total Scope 1 & 2 location based carbon emissions - energy and fuel use (tCO2e) | 18,444 | 20,781 | 22,065 |
| Total Scope 1 & 2 location based carbon emissions per FTE staff and student (tCO2e/FTE) | - | 0.84 | 0.99 |
| Total Scope 1 & 2 market based carbon emissions - energy and fuel use (tCO2e) | 13,112 | 15,605 | 22,065 |
| Scope 3 Emissions | 2024-2025 | 2023-2024 | 2018-2019 |
|---|---|---|---|
| Scope 3 emissions associated with capital goods (tCO2e) | 38,288 | 6,084 | 30,199 |
| Scope 3 emissions associated with procurement of goods and services (tCO2e) | 38,363 | 38,506 | 27,843 |
| Scope 3 emissions associated with business-related travel (tCO2e) | 5,886 | 5,434 | 9,450 |
| Scope 3 emissions associated with student commuting (tCO2e) | 5,684 | 4,340 | 5,250 |
| Scope 3 emissions associated with employee commuting (tCO2e) | 2,798 | 3,035 | 3,150 |
| Scope 3 emissions associated with student travel to and from home address (tCO2e) | 12,659 | 16,179 | 21,000 |
| Scope 3 emissions associated with waste (tCO2) | 10 | 42 | 102 |
| Scope 3 emissions associated with water (tCO2) | 31 | 26 | 74 |
| Scope 3 emissions associated with sewerage (tCO2e) | 39 | 43 | 201 |
| Scope 3 emissions associated with grid transmissions and distributions (tCO2e) | 558 | 458 | 434 |
| Total Scope 3 Emissions | 103,317 | 74,146 | 97,703 |
For more information on how to get involved, please contact sustainability@qub.ac.uk.